Lab 5:
An Overview of Recent Alaskan Earthquakes in a Web-based Story Map
Anchorage Daily News Earthquake Aftershock Info.
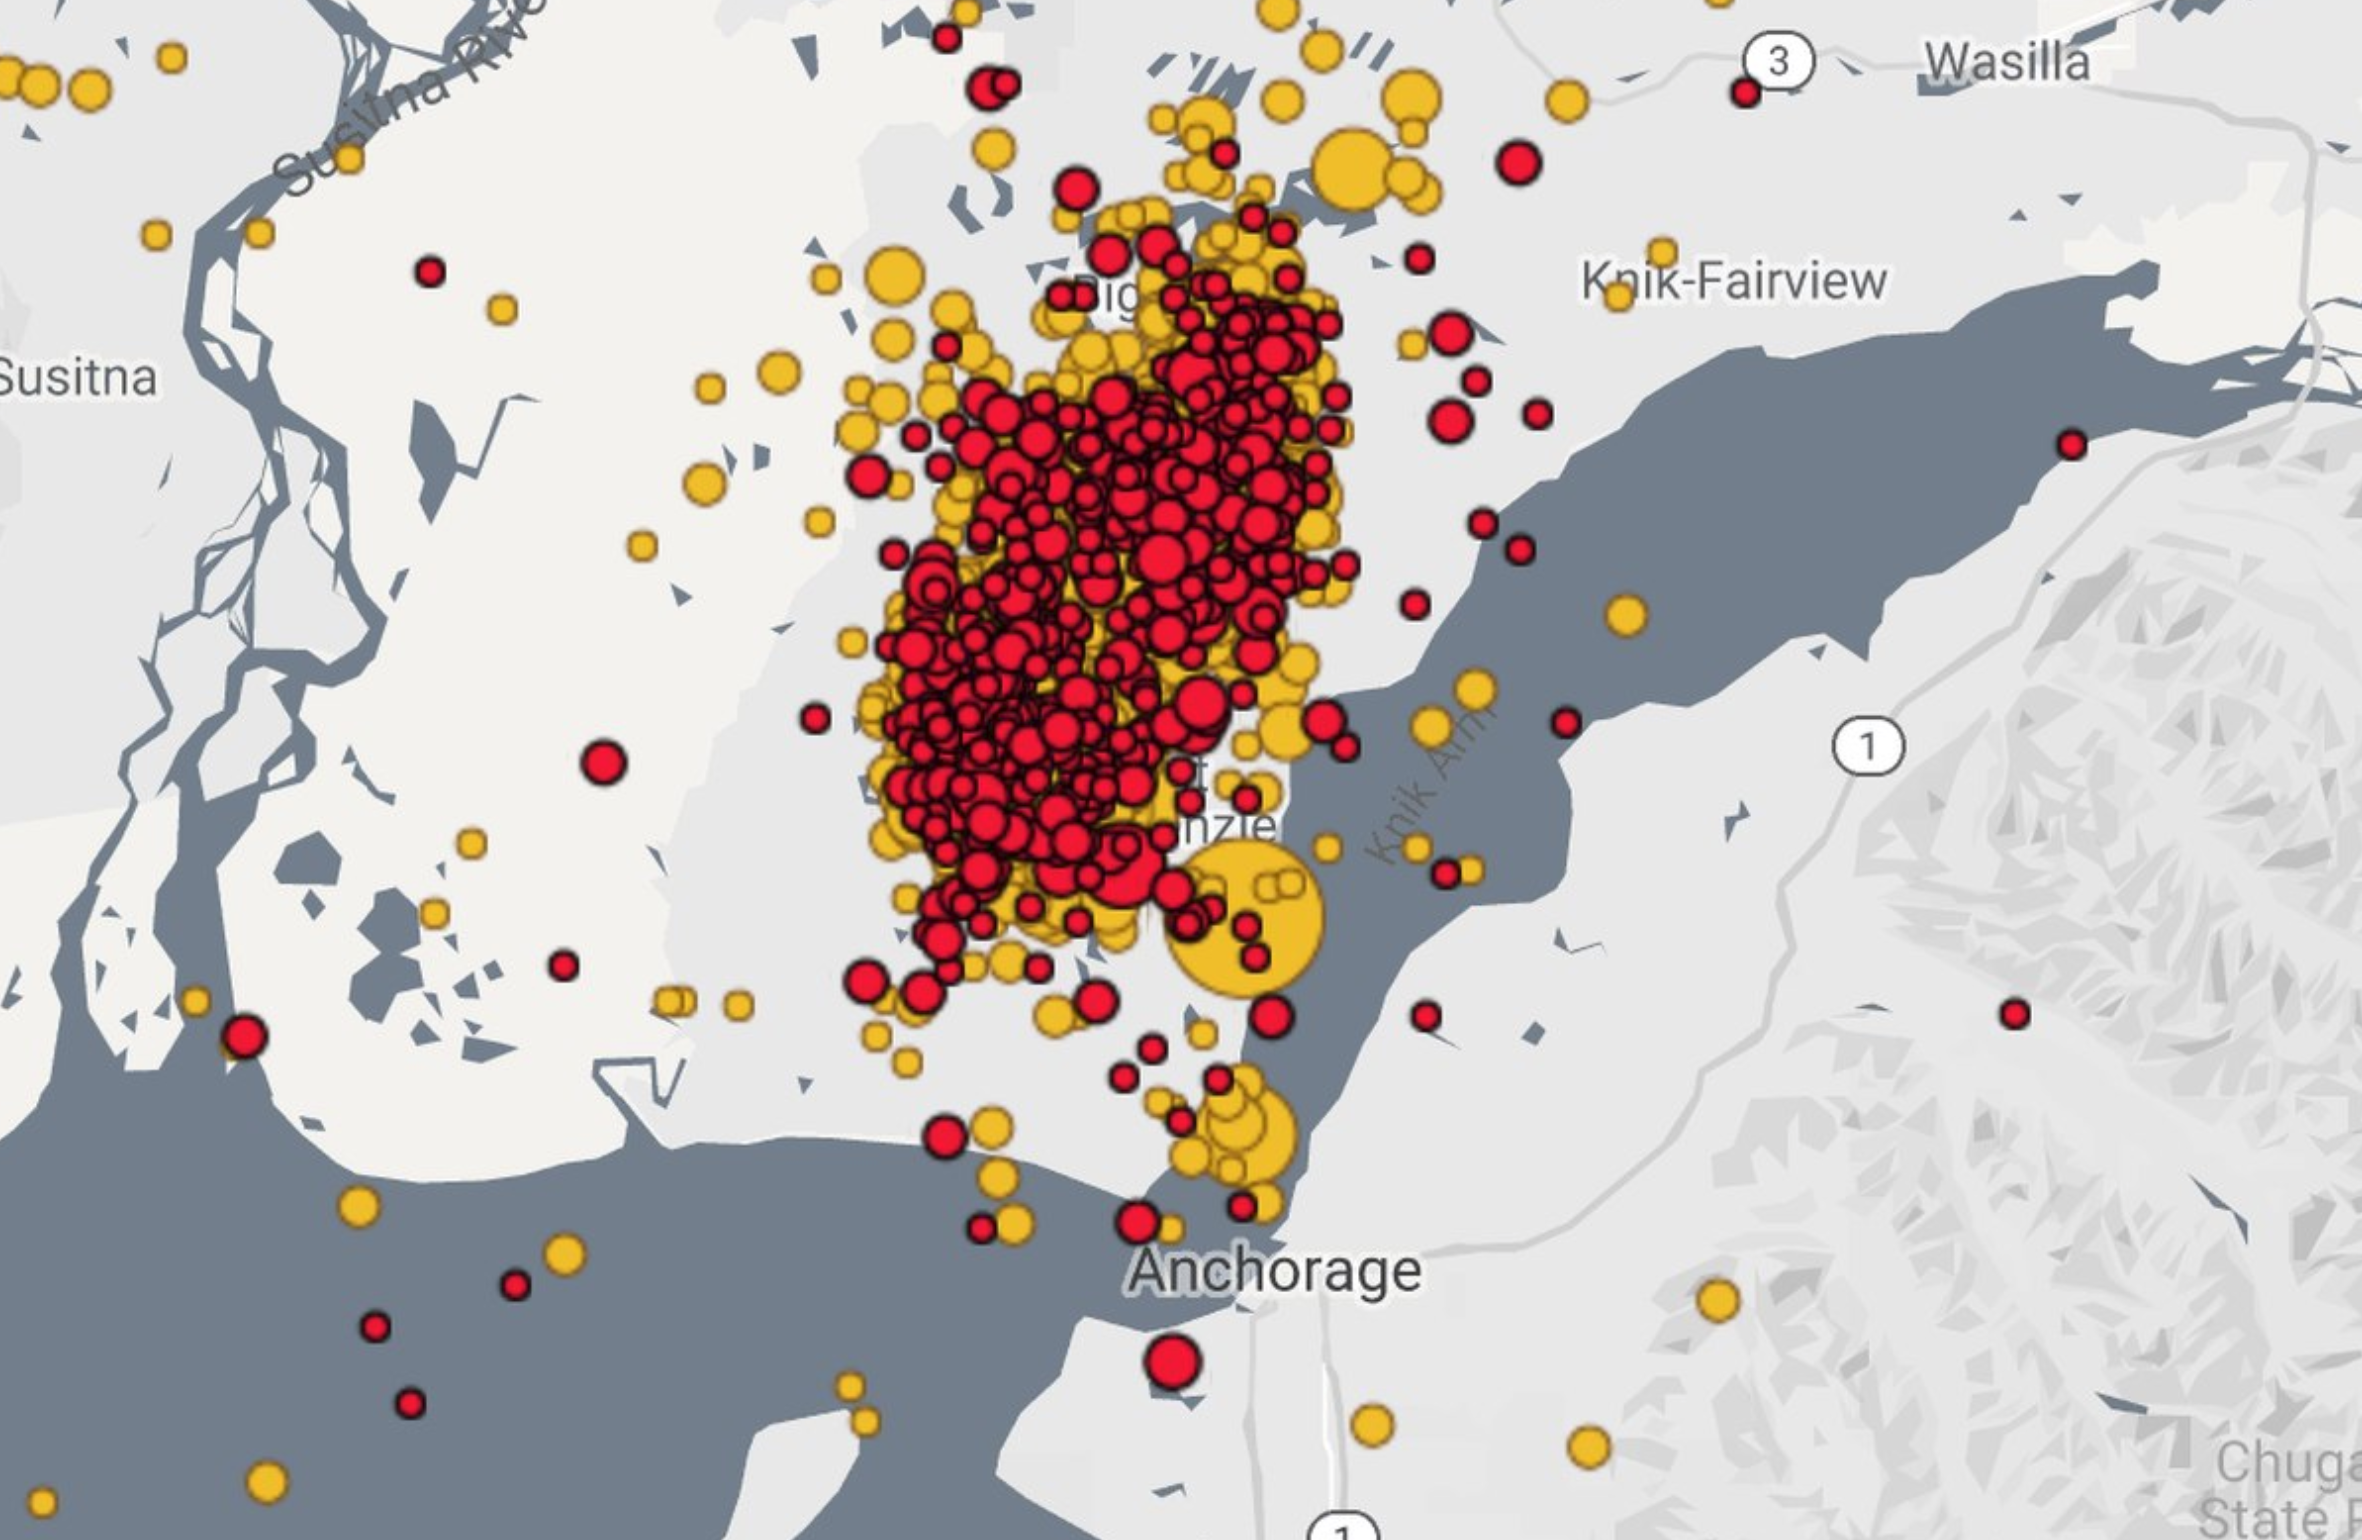
Please click the image above to be directed to the Anchorage Daily News Earthquake News
Earthquakes associated with Friday's 7.0 earthquake north of Anchorage as of 5:45 p.m. Sunday. The red dots represent shakes in the previous 24 hours, and the yellow dots are from the past week (with virtually all of them since Friday. The large dot directly north of the city was Friday's quake) Map from Alaska Earthquake Center.
The Weather Channel
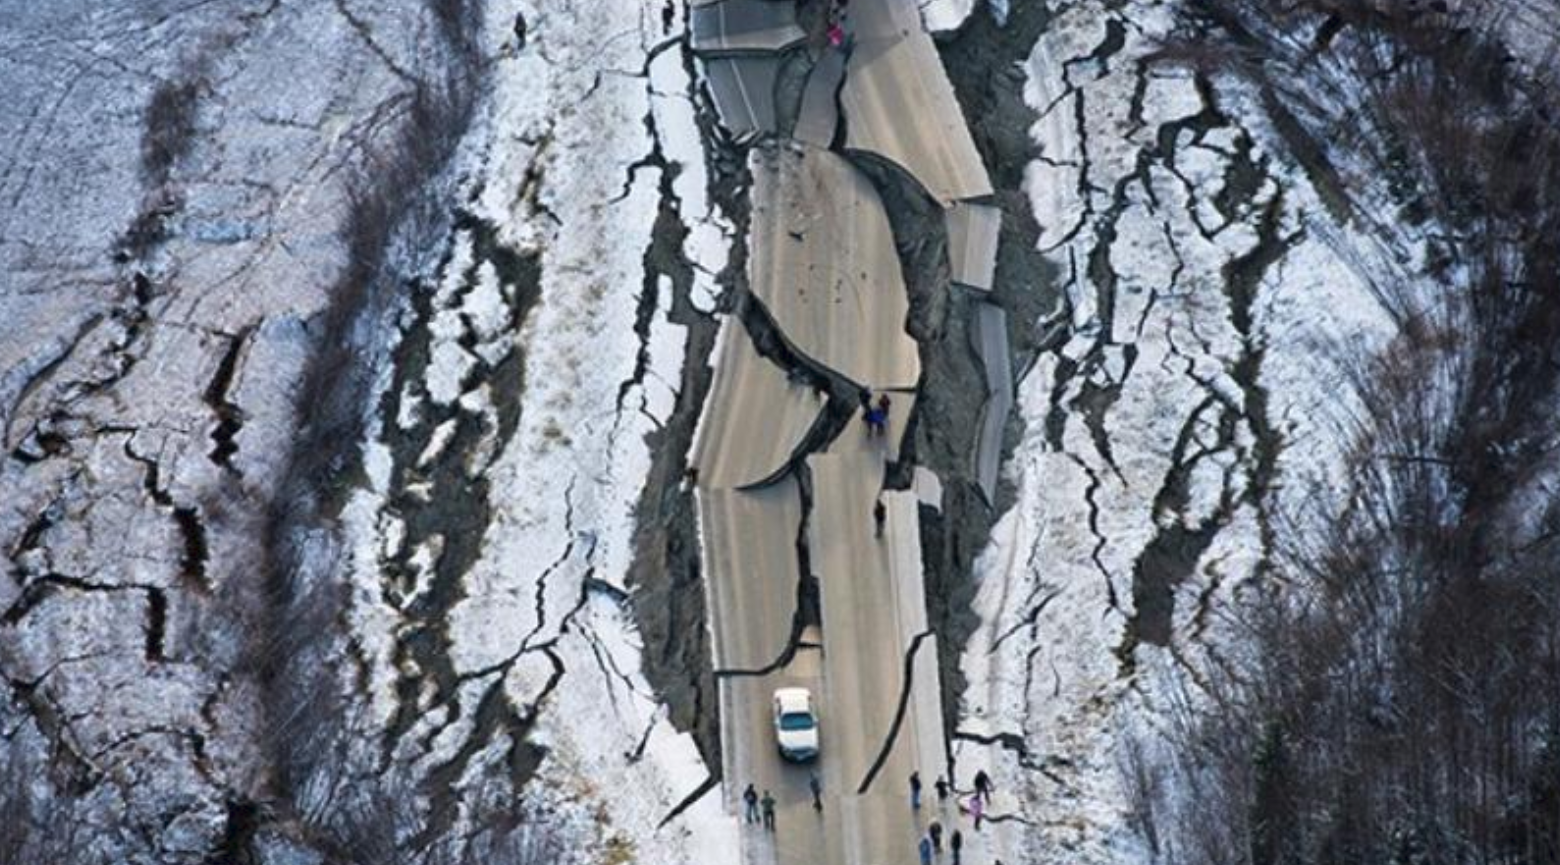
Please click the image above to be directed to the Weather Channel's Earthquake Info
Over 1,000 aftershocks struck the Anchorage, Alaska area since a 7.0 magnitude earthquake hit the city on Friday.
Mapbox Heatmap
Heatmap showing recent Alaskan earthquakes
The above map was designed using Mapbox. The map is displaying GeoJSON data of all earthquakes that happened in Alaska over the past month. This map is displaying the earthquake GeoJSON data by density in the form of a heatmap to help visualize how many earthquakes actually happened. The map has very limited functionality, as it was designed to be more of a visual aid with the ability to pan and scroll. Thank you for taking the time to read and interact with my maps.
Earthquakes near Anchorage, AK That Registered 4.5 or Higher Within the Past 30 Days
Significant Earthquakes near Anchorage, AK Over the Past Month
The above map was designed using Mapbox Studio. The map is displaying live GeoJSON data of earthquakes that were greater than 4.5 over the past month. The data is from a USGS live feed summary that constantly updates itself by retrieving data from USGS, as specified by the code running in the background. The map has the functionality to search for a place, pan and zoom, re-center on Anchorage, AK. Functionality includes the ability to toggle on and off the earthquake data and the ability to click each earthquake icon to display unique data about each. Thank you for taking the time to read and interact with my maps.