Utilizing LiDAR Data to Determine Avalanche Susceptibility of Mt. Hood, OR.
Background
As a Geospatial Professional, I decided to create an avalanche susceptibility map for Mt. Hood, Oregon. The reason why I choose this idea is that I am an avid snowboarder and several times throughout the year when I am up in the mountains either here in Washington or Oregon, I see avalanche signs and hear active blasts in the surrounding area. The preventive process of clearing avalanches is an important process as it clears snow from the mountains that could cause an avalanche, possibly destroying structures and/or killing people in its path.
At the end of this analysis I would like to know the areas that are used for recreation year-round on Mt. Hood that are most prone to avalanches.
To help guide me through the process of creating an avalanche susceptibility map, I utilized several scholarly journals to help develop best practices for conducting an analysis such as this. The journals are, “An ArcGIS Geo-Morphological Approach for Snow Avalanche Zoning and Risk Estimation in the Province of Bergamo,” by Barbara Marana and “Spatial modelling of snow avalanche run-outs using GIS,” by Biskupic, Marek and Barka, Ivan.
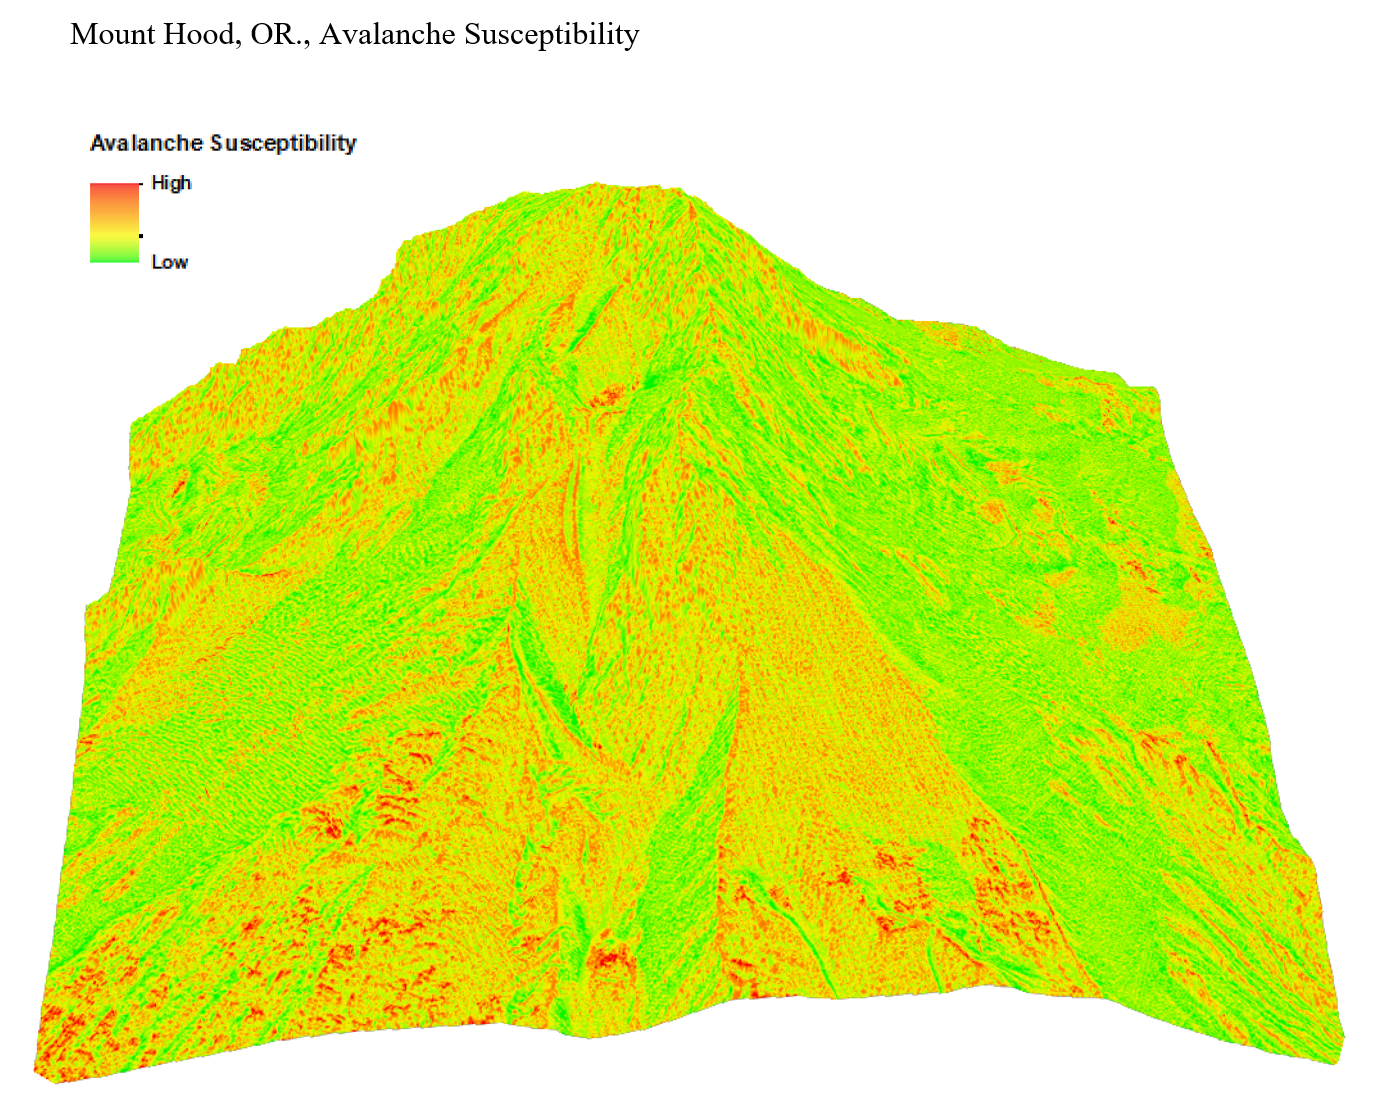
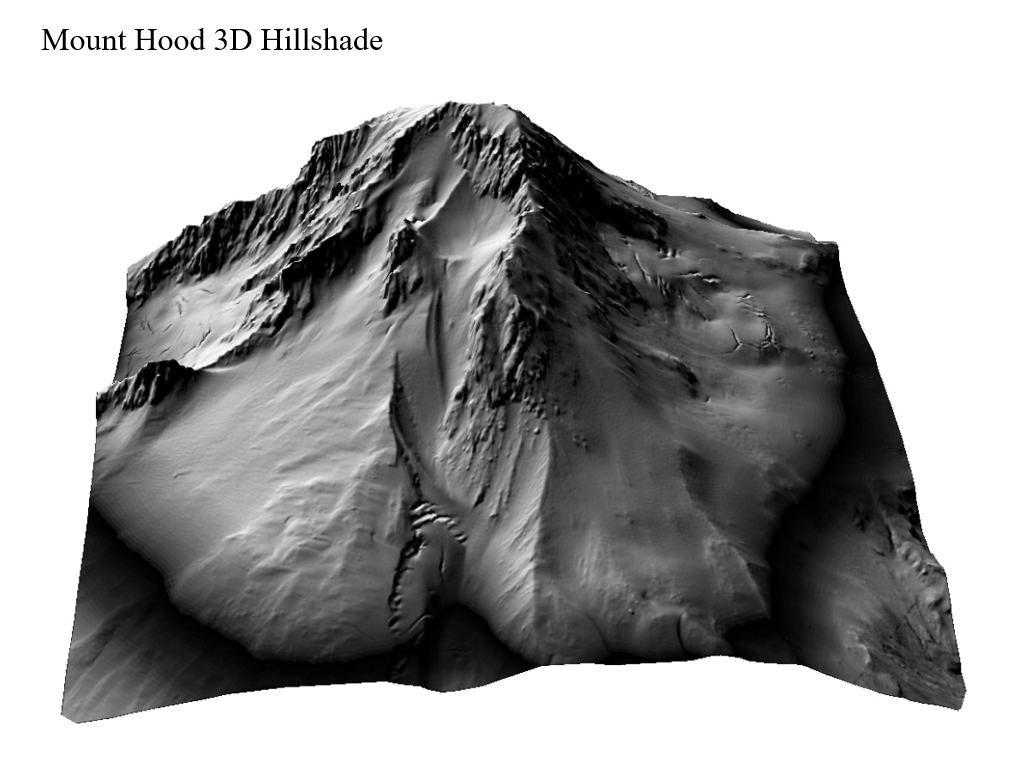
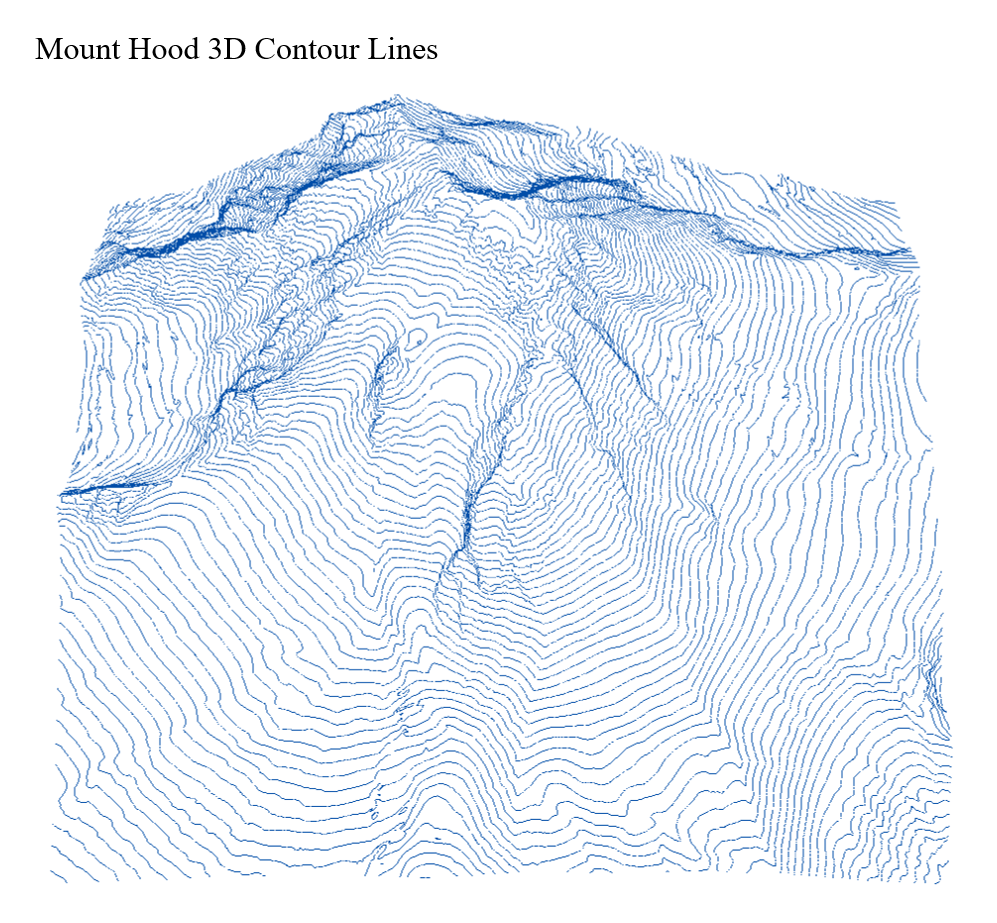
The model above consists of 3 layers that can be toggled on and off so you can see a 3D model of the avalanche susceptibility, a hillshade, and 2D map of the Mt. Hood surrounding area as a spatial reference.
Analytical Images